 Green circle, "CE"
 Green circle, arrow + "1"
 Red-orange bottle
Last updated: August 15, 2026
A network-testing client for Android built on iperf2, with live meters designed to let you correlate throughput, latency, and congestion-signal metrics as they happen, rather than reading one number in isolation.
If you've only ever used a speed-test app before, the biggest difference here is that this app cares as much about responsiveness under load as it does about raw Mbps. A link can report a great download number and still feel terrible for a video call or a game, because something else on the connection is queueing up traffic and adding delay. This app's Bounceback test is built specifically to catch that — see below — and several of its live meters (the L4S ones in particular) exist to show why a path is slow, not just that it's slow.
Download the APK from the
SourceForge file listing
(look for the iperf2*_android.apk file, not the big green "Download" button
at the top of the page, which grabs a different default file). Open it from your device's
Downloads or notification shade, and allow the one-time "install unknown apps" prompt.
On first launch, set Host to the server you want to test against and pick a test kind. The app remembers your last 5 host/port entries via the dropdown, and your other settings persist across restarts.
Every test is either Bounceback or Capacity, each independently run over TCP or UDP L4S via its own Transport selector.
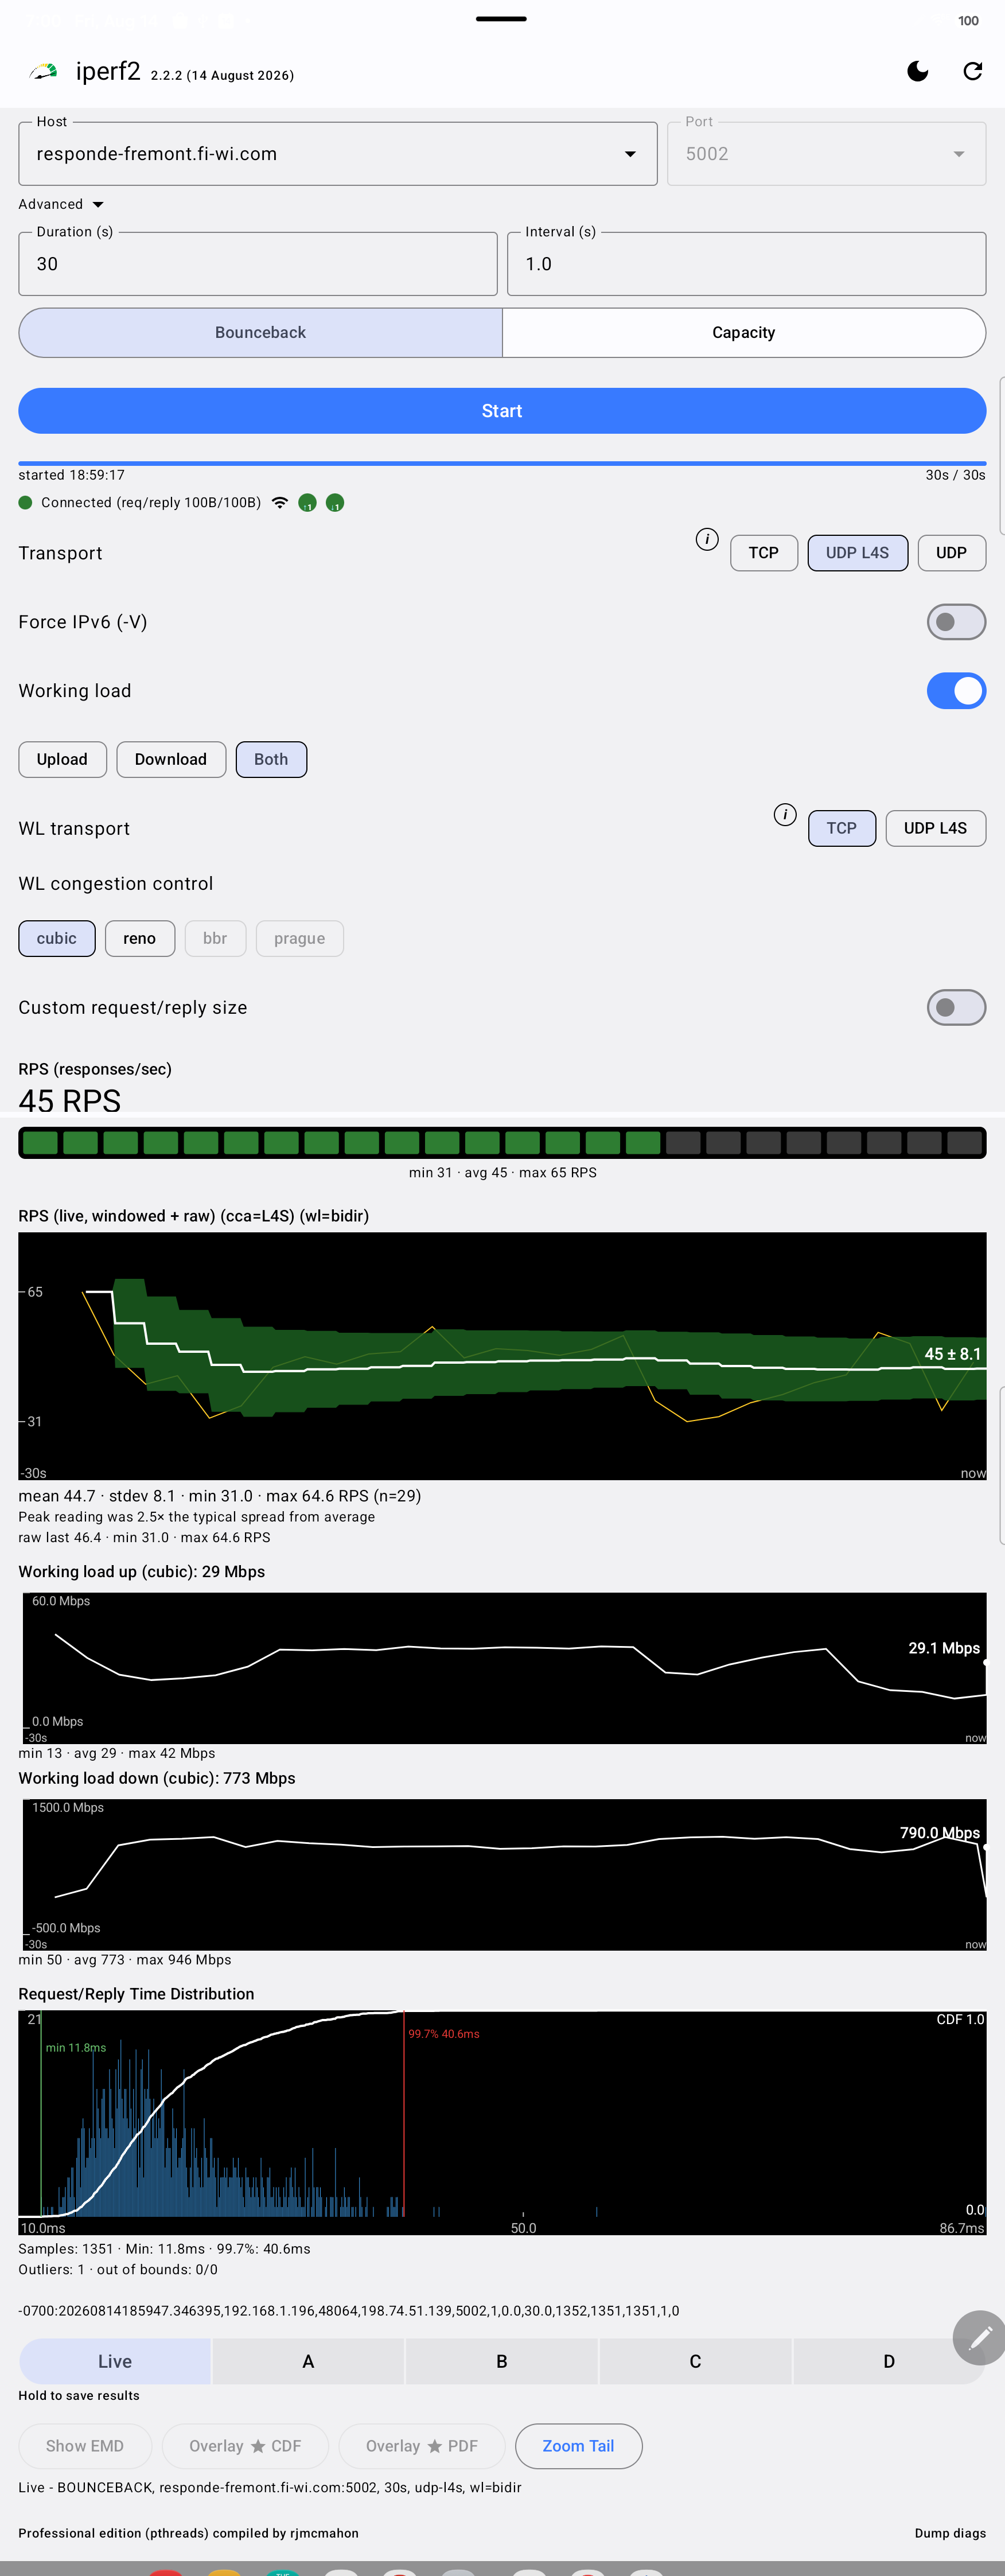 Live meters during a 30s Bounceback test with working load — tap for the full screenshot
Round-trip responsiveness testing (request/response, measured in RPS) — not idle-network latency. With the Working load toggle on, the app runs a concurrent background load underneath the responsiveness probes, so you can see how well round-trip times hold up when the link is actually busy — the same concept behind "responsiveness under working load" / bufferbloat testing.
| Metric | What it shows |
|---|---|
| RPS | Responses per second, with avg/min/max |
| RPS (live, windowed) | A windowed mean ± stdev band, so you can see whether responsiveness is stable or degrading under load |
| RTT min (kernel) / theoretical RPS ceiling | Shown under the RPS chart. Since each request waits for its reply before the next one is sent, 1000 / RTT-min is a hard ceiling on achievable RPS — comparing it against the observed RPS tells you whether a run is pacing-limited (well under the ceiling) or path-limited (pressed against it) |
| Request/Reply Time Distribution | Histogram of individual request/reply times, with a CDF (cumulative distribution function — at each point on the x-axis, what fraction of requests finished by then) line overlaid — see Comparing runs below for what the save/overlay controls under it do |
Over TCP, a congestion-control algorithm can optionally be selected (off by default, which just means no algorithm is requested and the kernel's own default is used). Over UDP L4S, Bounceback is a discrete stop-and-wait exchange with no congestion-control loop to switch, so there's no CCA choice for it.
A quick primer if L4S is new to you: normal internet queues handle congestion by either making packets wait (adding delay) or dropping them once a buffer fills up — both of which a video call or game feels as lag or a glitch. L4S (Low Latency, Low Loss, Scalable throughput) is a newer scheme where capable senders mark their own packets as "L4S-capable" (a header bit called ECT(1)), and any L4S-aware queue along the path can then respond to early congestion by marking those packets CE (Congestion Experienced) instead of delaying or dropping them. The sender sees the CE mark and backs off immediately, often before any human-perceptible delay builds up at all. The badges below exist because none of this is visible from throughput or RTT alone — they answer "is this actually happening on my path right now?".
Once a run connects, a colored dot and status line appear above the meters: green means connected with no retry needed, yellow means either the connection needed more than one attempt or a previously-good connection dropped mid-test, and red means it never connected at all. This row stays visible after the run stops or completes, the same as the meters below it, so you can review the final state without needing to catch it live.
Next to the status text, a small WiFi/Ethernet/Cellular icon shows which network interface the traffic actually used. It turns amber if that doesn't match a transport you explicitly forced — some devices report a live network connection without the requested interface bind actually taking effect at the socket level, so traffic can silently go out over a different interface than requested; the amber tint is how you'd notice.
Running Bounceback over its own UDP L4S transport specifically (not TCP, not plain UDP) can add up to three more badges after the network icon, each appearing only once there's a definitive result to show — nothing appears while a signal hasn't happened yet, rather than guessing:
 Close-up of the status row: WiFi icon, "CE" badge, and both directions confirmed intact
| Badge | What it means |
|---|---|
| Green circle, "CE" | The path's queue has applied at least one congestion-experienced (CE) mark this run — confirms a congestion-capable queue is actually there. There's no matching red state for this one: an absent mark doesn't confirm anything (could mean an unmarked path, or just no congestion yet), so nothing is shown until a mark actually occurs |
| Green circle, arrow + "1" | One per direction (an up arrow for your request reaching the server, a down arrow for the server's reply reaching you) — means that direction's ECT(1) mark arrived at the other end intact, i.e. confirmed L4S-capable end to end |
| Red-orange bottle | The direction-matched counterpart to the green arrow badge above, in the same up/down-oriented slot (upright for the request direction, upside-down for the reply direction) — means that direction's ECT(1) mark was stripped ("bleached") somewhere along the path by a non-L4S-aware middlebox, instead of arriving intact |
In practice: on most home and mobile connections you'll only ever see the two green confirmed-intact badges (or nothing, if the path never gets busy enough to say anything either way) — the red-orange bleached badge is what you're looking for specifically when diagnosing a network or middlebox that's silently discarding L4S markings.
Capacity's own UDP L4S stream gets the same treatment, just with one badge slot instead of two — Capacity is a single continuous flow (not a discrete request/reply pair), so there's only one direction's marking-integrity to report. The same green circle (this time plain "1", no arrow — there's nothing to disambiguate against) and red-orange bottle (upright, no flip) appear in the connection status row for Capacity/UDP L4S runs exactly like the Bounceback ones above.
Turning on Working load adds a background stream alongside the Bounceback probe, with its own independent controls:
| Control | What it does |
|---|---|
| Upload / Download / Both | Which direction(s) the background load runs |
| WL transport | TCP or UDP L4S for the load stream — independent of the main Bounceback probe's own transport |
| WL congestion control | TCP algorithm choice (cubic/reno/bbr/prague, subject to device support) under TCP, or Prague/Reno under UDP L4S |
| Working load up / down | Live throughput chart for each active direction |
Once running, a Pause/Resume working load button lets you stop the background load's writes mid-test — without tearing its connection down — so you can watch the Bounceback probe's own RPS/latency respond to load coming on and off, then resume it, all without restarting the whole run. This works for every direction now (upload, download, or both). While paused, the working-load chart shows a genuine gap rather than a misleading flat zero, so a deliberate pause never looks like the connection stalled.
Long-press a completed run to save it into one of four A/B/C/D slots - this works for any test kind, not just Bounceback. Tap a slot to view that saved run instead of the live one; long-press an already-saved slot again to star it as the reference. The comparison controls below, though, are Bounceback-specific - they work off the request/reply time distribution only a Bounceback run produces, so starring a Capacity run as the reference still lets you flip between saved slots, just without these particular overlays:
| Control | What it does |
|---|---|
| Overlay CDF / Overlay PDF | Draws the reference run's own CDF (cumulative — % of requests finished by time X, see above) or PDF (probability density — the histogram's raw shape, not cumulative, so a spike stays a spike instead of a step) curve on top of the one you're currently viewing |
| Show EMD | Shades the area between the current run's CDF and the reference's — that shaded region is the Earth Mover's Distance (EMD) number shown alongside it, so you can see at a glance whether the two runs diverge across the whole distribution or just part of it, not just read a scalar. Turning this on also forces the reference's CDF line on, since the fill needs both curves |
| Zoom Tail | Rescales the chart to just the slow tail (past this run's own 95th-percentile latency) — the whole-distribution view otherwise squeezes that region into an unreadably thin sliver at the right edge. Comes with its own "Tail (>95%): EMD …" stat, splitting the whole-distribution EMD into body + tail. Works standalone, without a reference |
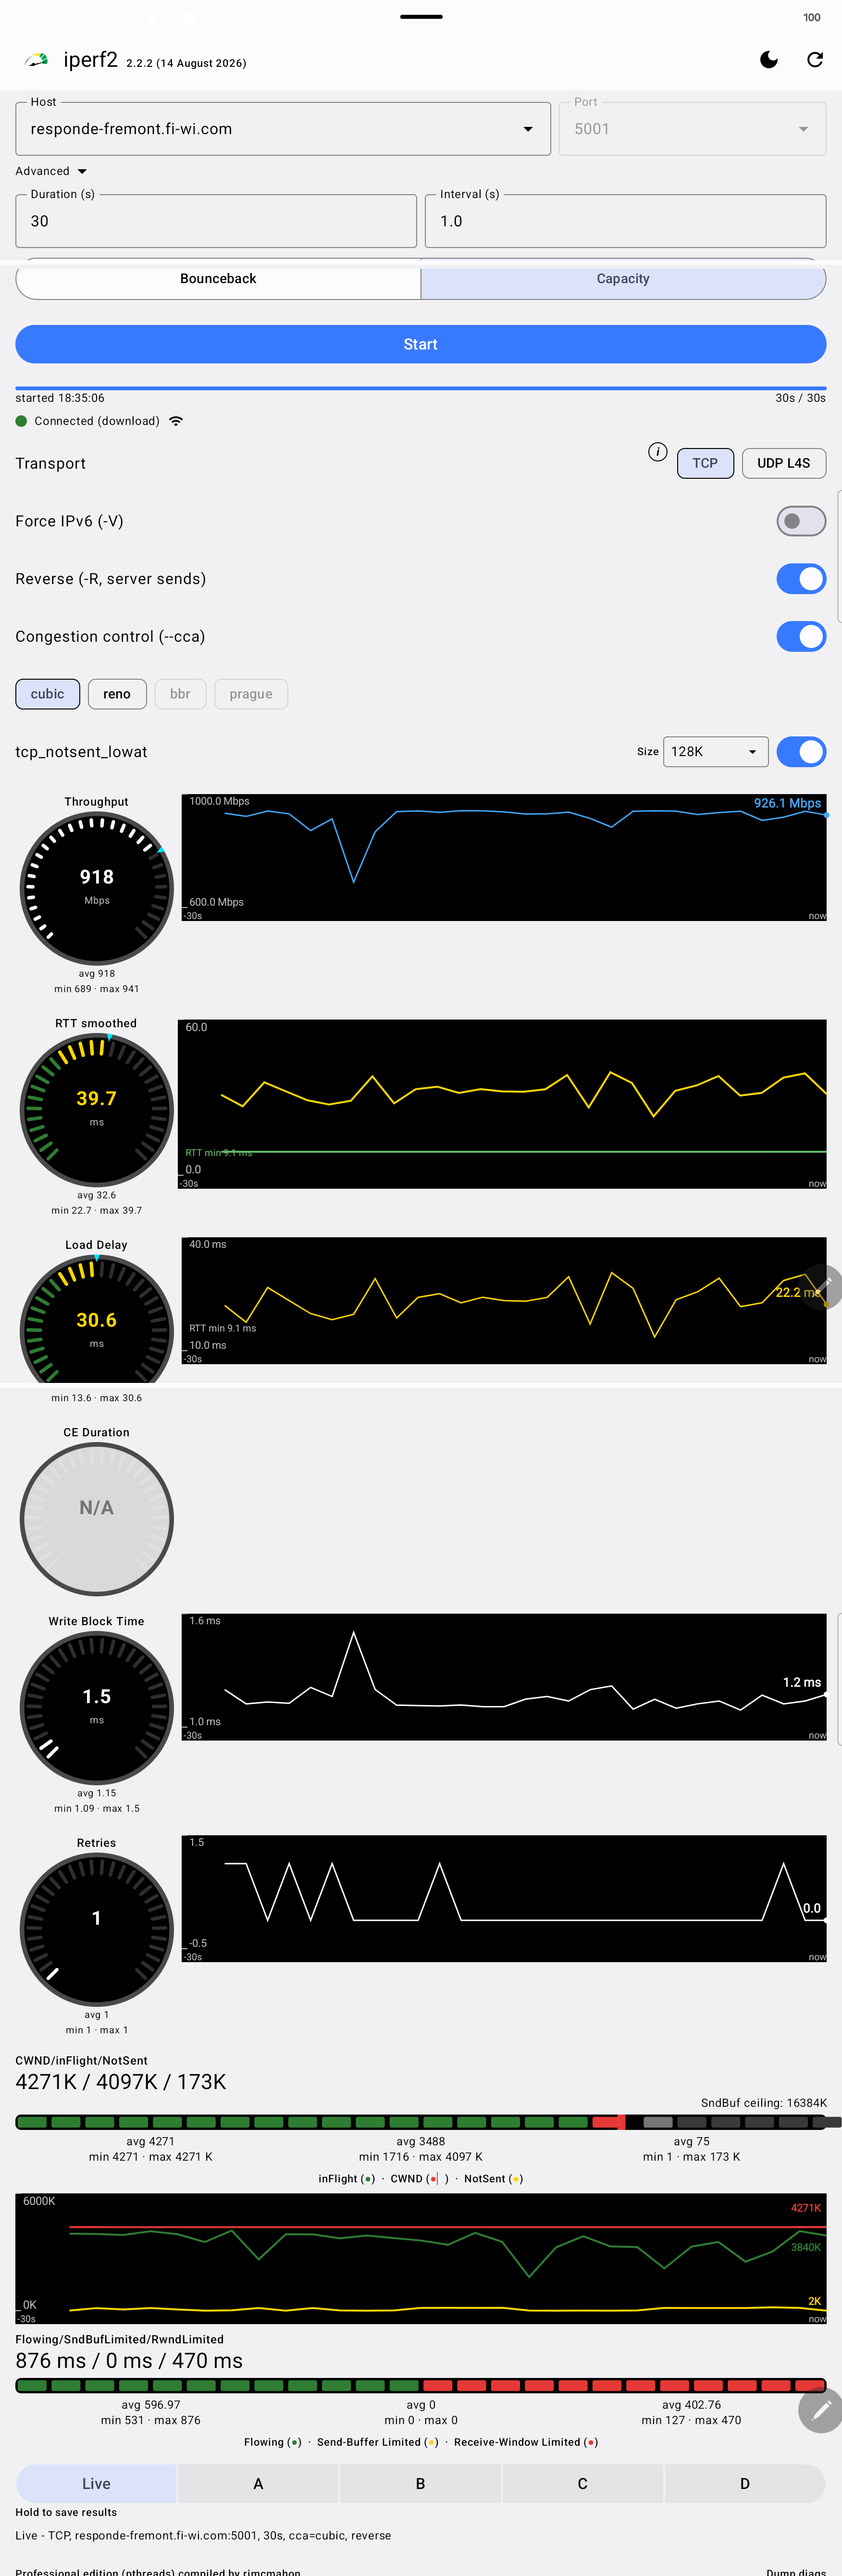 Live meters during a Capacity test — tap for the full screenshot
Continuous throughput testing, either transport:
TCP
| Metric | What it shows |
|---|---|
| Throughput | Instantaneous and average Mbps |
| RTT smoothed | Smoothed round-trip time, paired with a chart of current RTT riding above the connection's tracked RTT floor |
| Load Delay | Current RTT minus the RTT floor — the delay attributable to load on the path |
| CE Duration | Congestion-experienced marking duration (where supported by the path) |
| Write Block Time | Time the sender spent blocked on a full send buffer |
| Retries | TCP retransmissions |
| CWND / inFlight / NotSent | Combined chart of congestion window, bytes in flight, and bytes queued but not yet sent |
Congestion control algorithm is optionally selectable (off by default) from what's actually
available on your device: cubic, reno, bbr, or
prague (prague is greyed out on most stock devices — it needs a patched kernel
most don't have).
UDP L4S
Tests the L4S (Low Latency, Low Loss, Scalable throughput) congestion-signaling path.
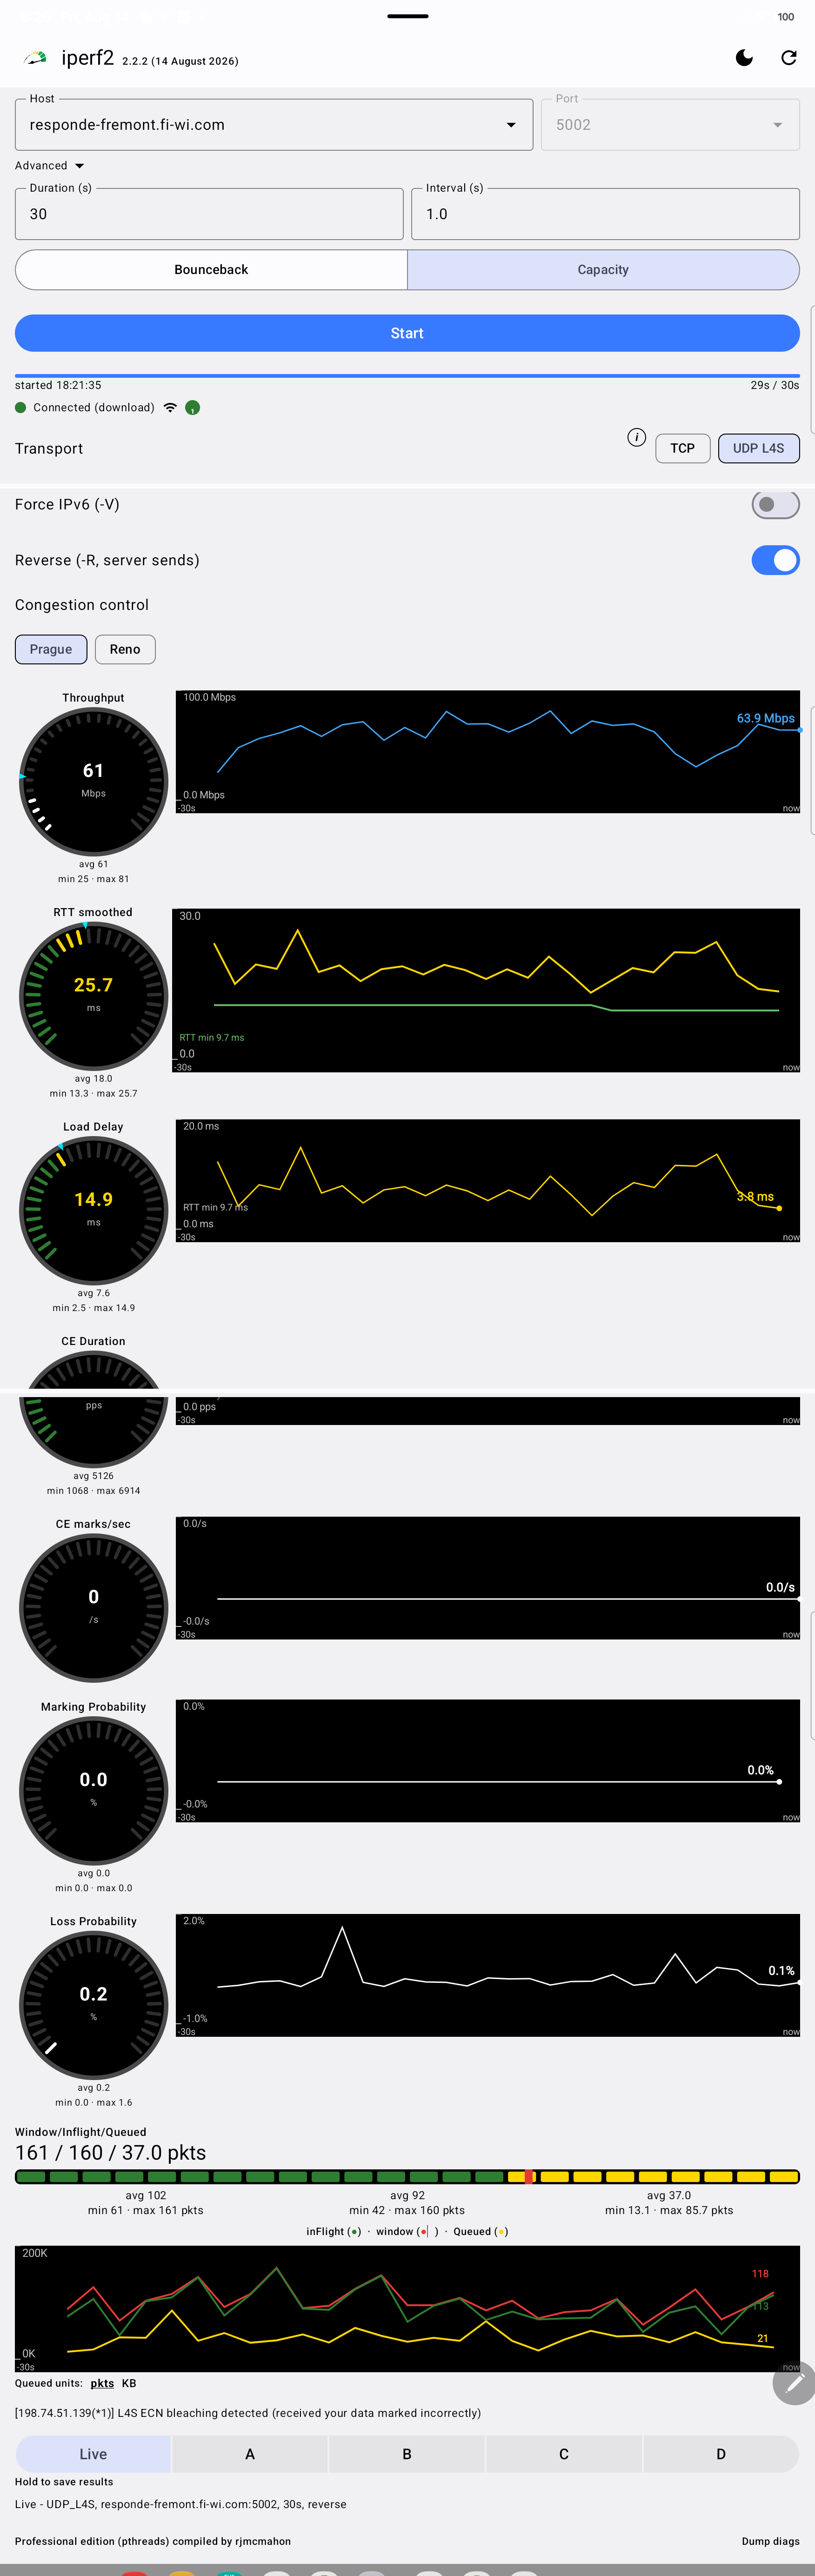 Live meters during a Capacity/UDP L4S test — tap for the full screenshot
| Metric | What it shows |
|---|---|
| Throughput, RTT smoothed, Load Delay, CE Duration | Same meaning as the TCP versions above |
| Packets/sec | UDP packet rate |
| CE marks/sec | Rate of congestion-experienced (CE) marks received |
| Marking Probability | Fraction of packets arriving CE-marked, with an estimated max flow rate (r = 1/p − 1 Mbps, per published L4S guidance) shown alongside it |
| Loss Probability | Fraction of packets lost |
| Window / Inflight / Queued | Combined chart, the UDP-L4S counterpart of TCP's CWND/inFlight/NotSent view |
Congestion control here is always either Prague (the default) or
Reno — unlike TCP there's no "off", since UDP L4S always runs one of the two.
Most metrics are shown as a small dial paired with a time-series sparkline beside it, each with a time axis ("-Ns" to "now") derived from your configured Interval. The dial gives the current reading plus avg/min/max; the sparkline lets you see the trend and line up a spike in one metric against what else was happening at the same moment.
| Option | What it does |
|---|---|
| Duration / Interval | Test length and reporting interval, in seconds — see the note on the public responde.* servers' own 60-second cap below |
| Reverse (-R) | Server sends instead of the client (TCP/UDP L4S) |
| Force IPv6 (-V) | Forces resolution/connection over IPv6 instead of the default IPv4-first behavior — useful for confirming whether a v6 path actually works on your current network. All responde.* test servers support IPv6 |
tcp_notsent_lowat | Caps how much unsent data the kernel buffers, for more responsive write-blocking behavior (TCP) |
| Custom request/reply size | Override the default Bounceback request/response payload sizes |
For non-local hosts, the app already sends a permit key automatically and silently — you
never need to touch anything to test against the built-in responde.* servers.
This is only for pointing the app at your own permit-key-gated server (a
different key than the app's own), which the automatic one can't authenticate to.
Tap Advanced, just under the Host/Port row, to reveal a Permit key field. It's per-host: whatever you type is remembered against the host currently in the Host field, and switching hosts (by typing a different one or picking from the dropdown) automatically swaps in that host's own saved key — Advanced even expands or collapses itself depending on whether the host you land on has one saved. The × button in the field clears it and forgets it for that host in one tap, rather than requiring you to backspace through it.
responde.* hosts that
ship as the app's default targets exist to verify the app itself works end to end —
connects, authenticates, renders the live meters correctly. They are not sized for load
testing, so don't read anything into the throughput/RPS numbers you see against them.
Point the app at your own iperf2 server if you want numbers that mean something for your
own path. The 11 servers, one per region:
responde-fremont.fi-wi.comresponde-vienna.fi-wi.comresponde-newark.fi-wi.comresponde-london.fi-wi.comresponde-mumbai.fi-wi.comresponde-singapore.fi-wi.comresponde-sydney.fi-wi.comresponde-saopaulo.fi-wi.comresponde-lax.fi-wi.comresponde-chicago.fi-wi.comresponde-tokyo.fi-wi.comresponde.*
host. Your own server can be configured however you like.
Build from the 2-2-2 branch of
the iperf2 project with
--enable-professional - Bounceback, UDP L4S, and the metrics this app relies
on aren't available on an older release or a plain community build:
git clone https://git.code.sf.net/p/iperf2/code iperf2
cd iperf2 && git checkout 2-2-2
./configure --enable-professional
make && sudo make install
One process covers everything the app needs via --dual-transport, which also
listens for whichever of TCP/UDP L4S isn't the main port's own transport, on the adjacent
port (TCP on port N also gets UDP L4S on N+1). Bounceback and UDP L4S are negotiated per
connection from what the app itself requests, so don't pass --bounceback or
--udp-l4s on the server - -V additionally enables IPv6
(without it, the server only listens on IPv4):
iperf -s -p 5001 --dual-transport -V --enhancedSet the app's own Port to 5001, matching the server's own base port above - don't set it to 5002 yourself. Selecting a transport that needs the L4S port (Capacity's UDP L4S mode, or Bounceback with its transport set to UDP L4S or plain UDP) shifts the Port field to 5002 for you automatically; switching back shifts it back.
Working load traffic (its own WL transport selector, default TCP) reuses the same port as the main test whenever both sides use the same transport - two TCP connections to one port coexist fine, told apart by their own distinct source ports, same as any other pair of TCP connections to the same destination. A port shift only happens when the two transports actually differ, since this server topology serves TCP and UDP L4S as separate listeners one port apart:
| Bounceback transport | WL transport | Port relationship |
|---|---|---|
| TCP | TCP | Same port |
| TCP | UDP L4S | WL shifts +1 (needs the UDP L4S listener) |
| UDP (plain) | TCP | WL shifts -1 (needs the TCP listener) |
| UDP (plain) | UDP L4S | Same port (both UDP) |
| UDP L4S | TCP | WL shifts -1 (needs the TCP listener) |
| UDP L4S | UDP L4S | Same port (both UDP) |
Either way, the app computes this automatically - the single --dual-transport
server above already covers all six combinations, nothing extra to run.
Without a permit key, that server is fully open - anyone who knows the hostname can
connect. To gate access, add --permit-key-file - permit keys are a
--enable-professional feature only, the flag doesn't exist in a community
build. It reads a plain NAME=VALUE file (default path
/etc/iperf2/permit-keys.env) where any line whose name contains
PERMIT_KEY contributes its value as one accepted key - so
PERMIT_KEY_FOO= and PERMIT_KEY_BAR= can both be valid at once,
useful for rotating a key without a hard cutover:
# /etc/iperf2/permit-keys.env
PERMIT_KEY_FOO=a1b2c3d4e5f6...
PERMIT_KEY_BAR=9f8e7d6c5b4a...
Reloads on SIGHUP (kill -HUP $(pgrep -x iperf)) without a
restart. Whatever key you put in the file, paste the same value into the app's own
Permit key field above.
Under systemd, a minimal unit for the gated version:
[Unit]
Description=iperf2 server (dual-transport)
After=network.target

[Service]
ExecStart=/usr/local/bin/iperf -s -p 5001 --dual-transport -V --enhanced --permit-key-file
Restart=on-failure
User=iperf
Group=iperf

[Install]
WantedBy=multi-user.target